Fun with graphs
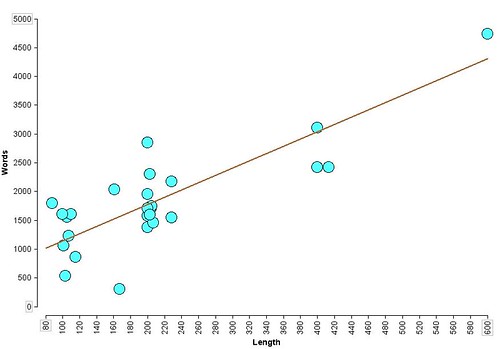
The best was curious about whether the length of my posts about various rides I’ve done varies according to the length of the rides, so I pulled together a dataset containing all of the rides I’ve done since May (5000 km, give or take a dozen) and handed them to her for plotting with Tinkerplots.
Huh, that’s interesting; the post length, at least for this summer, certainly looks like it depends on the length of the ride.
